Road freight transport by type of goods

Road freight transport by type of goods (NST 2007 classification[1])
Tables 1a and 1b present road freight transport by product group, measured in tonnes and tonne-kilometres (tkm)[2], respectively, over the period 2018-2022. In terms of tonnes of freight carried, EU road transport fell by 0.5 % in 2022 compared with 2021. The number of tonnes carried registered an average annual growth rate of 0.7 % in the period 2018-2022.
In 2022, the product group 03 'metal ores and other mining and quarrying products; peat; uranium and thorium' was the largest product group transported in terms of tonnage, accounting for 3 338 million tonnes; its share in the total EU tonnes transported was 24.5 % (see Table 1a and Figure 1). It was followed by product group 09 'other non-metallic mineral products' (1 759 million tonnes and a share of 12.9 %) and product group 04 'food products, beverages and tobacco' (1 599 million tonnes and a share of 11.7 %). Another major product group was 01 'products of agriculture, hunting, and forestry; fish and other fishing products', accounting for 1 277 million tonnes and a share of 9.4 %.
From 2021 to 2022, the tonnage carried by road decreased for 11 product groups. The highest declines were observed in groups 12 'transport equipment' (-9.7 %) and 06 'wood, paper and their products' (-9.1 %). The highest increases were observed in groups 19 'unidentifiable goods' (+14.5 %), 20 'other goods' (+12.9 %) and 18 'grouped goods' (+7.7 %).
In terms of average annual growth rate in the period 2018-2022, product group 15 'mail, parcels' recorded the highest growth, at 8.6 %, followed by 19 'unidentifiable goods' (+5.0 %) and 18 'grouped goods' (+4.8 %). The highest negative average annual growth rates were recorded by groups 02 'coal and lignite' (-7.5 %), 12 'transport equipment' (-4.7 %) and 17 'goods moved in the course of household and office removals' (-1.4 %).
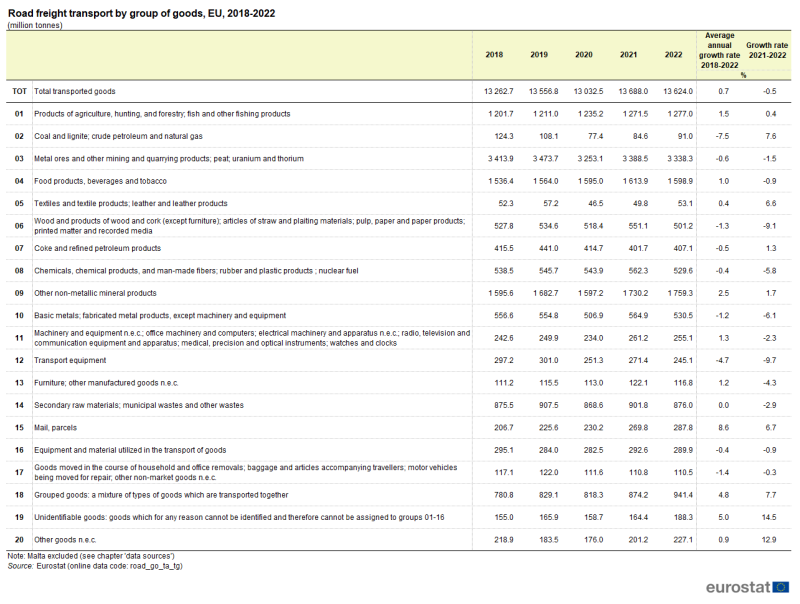 Table 1a: Road freight transport by group of goods, EU, 2018-2022(million tonnes)Source: Eurostat (road_go_ta_tg)[3]
When looking at road freight transport performance in tonne-kilometres, in 2022 the total EU performance was almost at the 2021 level with a slight decrease of 0.1 %. The goods group 04 'food products, beverages and tobacco' was the top group, accounting for 317 billion tkm; its share in the total EU tkm was 16.6 % (see Table 1b and Figure 1).
Thereafter followed groups 18 'grouped goods' (229 billion tkm and a share of 11.9 %) and 01 'products of agriculture, hunting, and forestry; fish and other fishing products' (203 billion tkm and a share of 10.6 %). Another product group that recorded significant transport performance was 09 'other non-metallic mineral products', with 159 billion tkm and a share of 8.3 %. The highest rises in terms of tkm from 2021 to 2022 were recorded for product group 20 'other goods ' (+24.8 %), followed by groups 16 'equipment and material utilized in the transport of goods' (+7.5 %) and 15 'Mail, parcels' (+4.8 %).
At the other end of the scale, the highest decreases were recorded for product groups 13 'furniture; other manufactured goods n.e.c.' (-6.2 %) and 08 'chemicals/fibers, rubber/plastic products; nuclear fuel' (-6.1 %), followed by group 06 'Wood, paper and their products.' (-5.3 %). The highest positive average annual growth rates in the period 2018-2022 were recorded for product group 19 'unidentifiable goods' (+9.3 %), followed by groups 15 'mail, parcels' with 8.9 % and 18 'grouped goods' with 4.9 %. The highest negative average annual growth rates were recorded for groups 17 'goods moved in the course of household and office removals' and 12 'Transport equipment' (-1.6 % each).
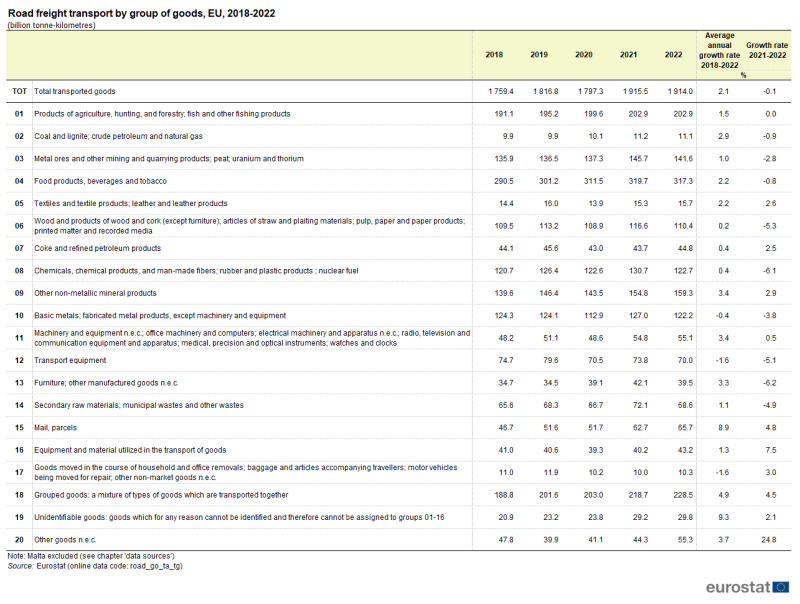 Table 1b: Road freight transport by group of goods, EU, 2018-2022(billion tonne-kilometres)Source: Eurostat (road_go_ta_tg)[4]
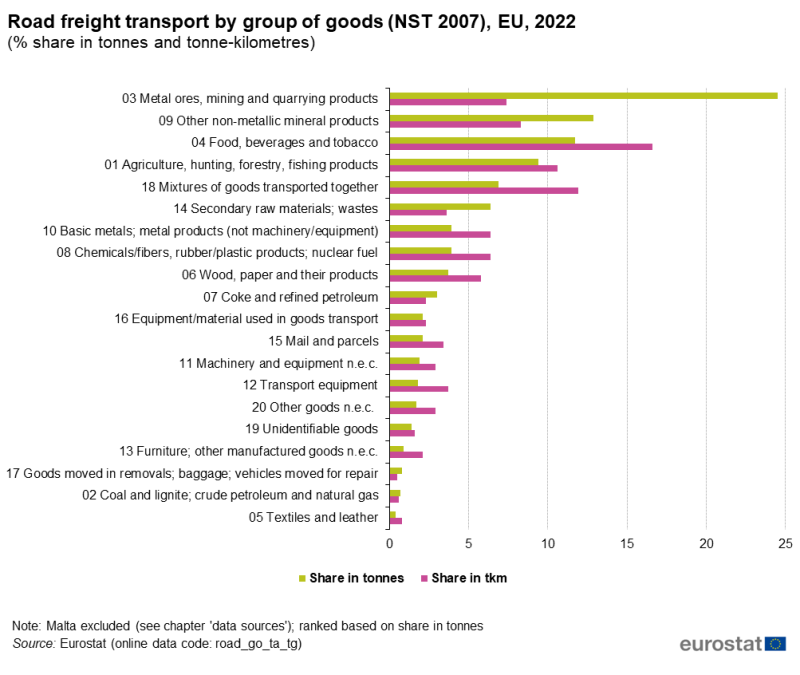 Figure 1: Road freight transport by group of goods (NST 2007), EU, 2022(% share in tonnes and tonne-kilometres)Source: Eurostat (road_go_ta_tg)[5]Full names and description of NST 2007[6] codes
Figure 2 shows the tonne-kilometre share of each NST 2007 goods group in the EU total for national[7] and international[8] road freight transport.
In 2022, the following groups had a higher share in national transport than in international transport: 01 ' agriculture, hunting, forestry, fishing products', 02 'coal and lignite; crude petroleum and natural gas', 03 'metal ores, mining and quarrying products', 04 'food, beverages and tobacco', 07 'coke and refined petroleum products', 09 'other non-metallic mineral products', 14 'secondary raw materials; wastes', 15 'mail and parcels', and 17 'goods moved in removals; baggage; vehicles moved for repair'. For the remaining groups, their share for international road freight transport was higher than for national transport.
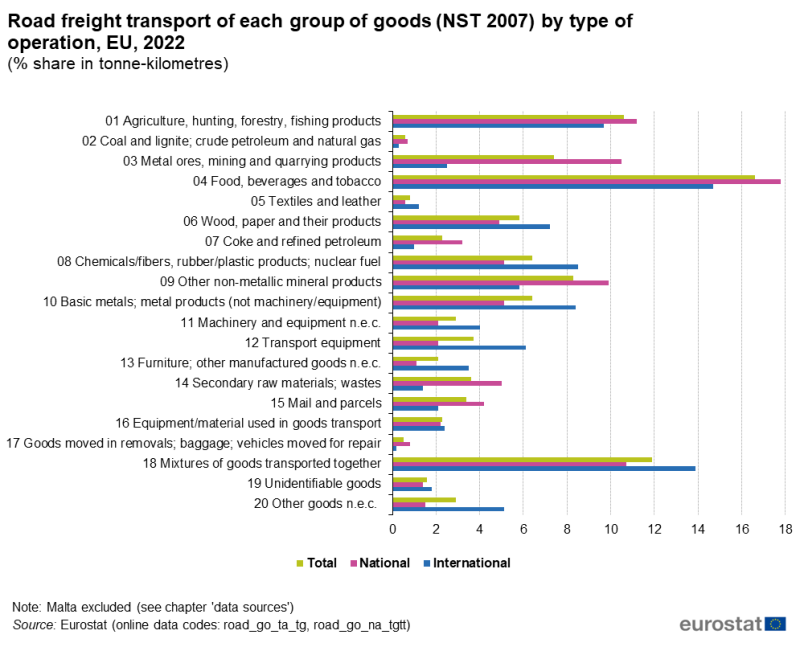 Figure 2: Road freight transport of each group of goods (NST 2007) by type of operation, EU, 2022(% share in tonne-kilometres)Source: Eurostat (road_go_ta_tg)[9], (road_go_na_tgtt)[10]Full names and description of NST 2007[11] codes
Road freight transport of dangerous goods
Figure 3 presents the share of dangerous goods in the total transport performance (in tkm) of each EU Member State in 2021 and 2022. At EU level, the share of dangerous goods transport was 3.8 % in 2021 and 3.5 % in 2022.
The EU Member States that recorded the highest shares of dangerous goods in their road transport were Finland (with 6.9 % in 2021 and 10.5 % in 2022) and Cyprus (with 10.9 % in 2021 and 9.7 % in 2022), followed by Belgium (with 8.3 % in 2021 and 7.7 % in 2022). In both 2021 and 2022, several EU countries recorded figures between 4.0 % and 5.0 %, including the big countries France and Spain. Germany recorded shares of 3.8 % in 2021 and 3.9 % in 2022, while Poland recorded shares of 2.4 % in 2021 and 2.0 % in 2022.
Slovakia, Lithuania and Ireland recorded shares of dangerous goods transport performance of less than 2.0 % in both years, while the Netherlands recorded a share of 2.0 % in 2021 and 1.8 % in 2022.
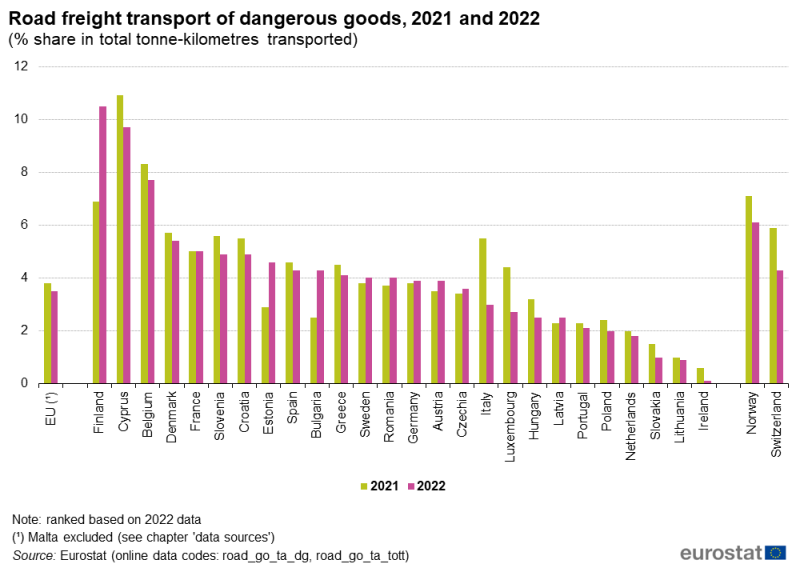 Figure 3: Road freight transport of dangerous goods, 2021 and 2022(% share in total tonne-kilometres transported)Source: Eurostat (road_go_ta_dg), (road_go_ta_tott)[12][13]
EU transport of dangerous goods accounted for 67 455 million tkm in 2022 (see Table 2) and presented a negative average annual growth rate of 1.5 % in the period 2018-2022. Between 2018 and 2022, 15 EU Member States registered a negative average annual growth rate in the transport of dangerous goods.
The highest ones were recorded for Ireland (-41.1 %), Luxembourg (-20.2 %) and Italy (-14.7 %). At the other end of the scale, the highest positive average annual growth rates were registered in Bulgaria (+39.5 %), Finland (+13.5 %) and Czechia (+11.9 %). When looking at the changes between 2021 and 2022, the average annual growth rate in the transport of dangerous goods decreased by 7.1 %.
Sixteen EU Member States registered decreases in the transport of dangerous goods, the highest ones in Ireland (-85.0 %), Italy (-44.2 %), Luxembourg (-34.8 %) and Slovakia (-33.5 %). Substantial increases were observed in Bulgaria (+74.3 %), Finland (+57.7 %) and Estonia (+36.4 %).
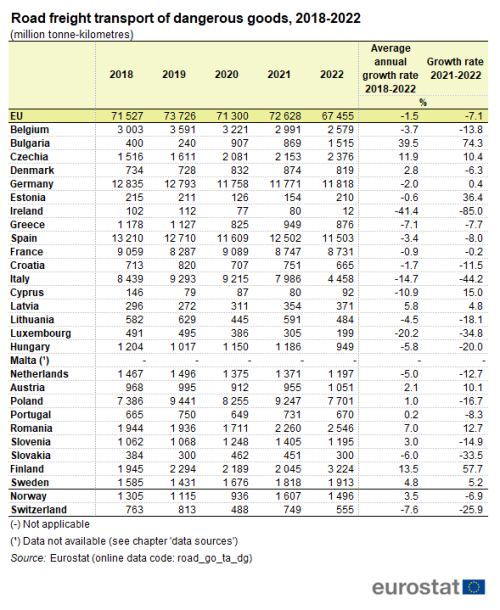 Table 2: Road freight transport of dangerous goods, 2018-2022(million tonne-kilometres)Source: Eurostat (road_go_ta_dg)[14]
Figure 4 shows the share of dangerous goods transport performance in the total tkm performed within a country and internationally in 2022. In half of the EU Member States, 75.9 % of the transport of dangerous goods was performed within the national territory.
For most countries, in 2022, the share of tkm performed in international transport involving dangerous goods is aligned with the share in tkm of international transport of all types of goods (see article 'Road freight transport by journey characteristics'[15], Figure 2). This means that in general, countries with high shares in tkm of international transport of all types of goods tend to have a higher share of tkm performance in international transport involving dangerous goods. Notable exceptions are Bulgaria, Estonia, Hungary and Romania: although international transport of all types of goods represented more than half of the road transport of these countries, most of their transport of dangerous goods was performed in national territory.
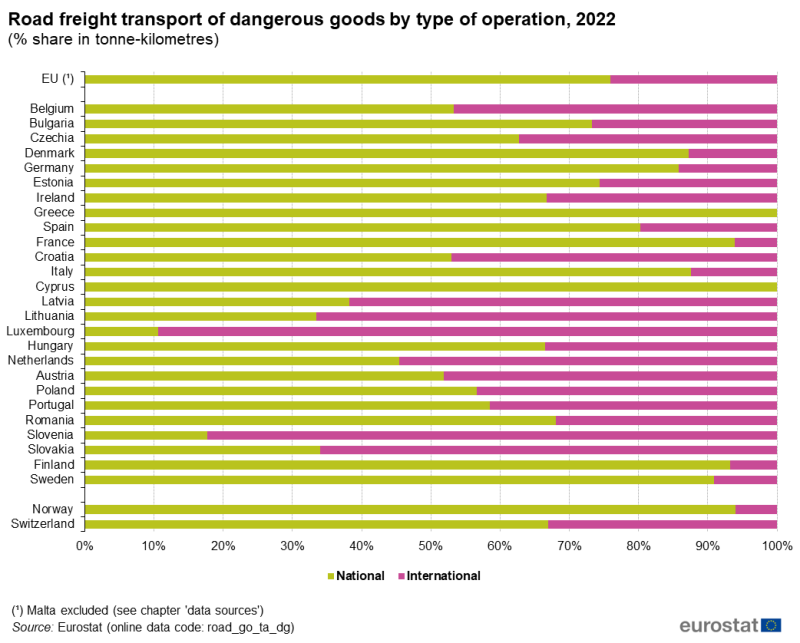 Figure 4: Road freight transport of dangerous goods by type of operation, 2022(% share in tonne-kilometres)Source: Eurostat (road_go_ta_dg)[16]
Figure 5 shows the shares of the different types of dangerous goods in the tkm performed involving dangerous goods in the EU, in 2022.
The largest group was 'flammable liquids', accounting for a half of the transport of dangerous goods (50.0 %). 'Gases, compressed, liquified, dissolved under pressure' accounted for 13.7 %, while 'corrosives' accounted for 12.5 %. These three types of dangerous goods accounted for over three-quarters (76.2 %) of the total tkm performed involving dangerous goods.
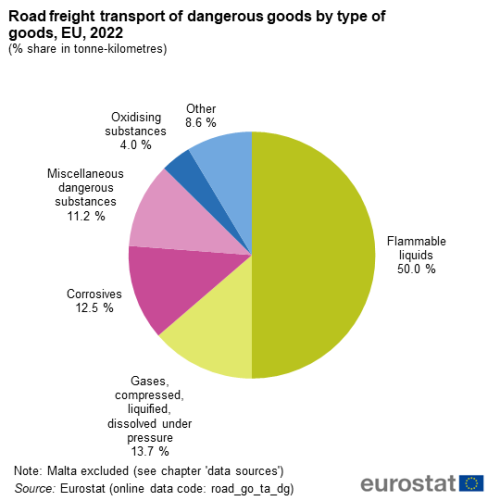 Figure 5: Road freight transport of dangerous goods by type of goods, EU, 2022(% share in tonne-kilometres)Source: Eurostat (road_go_ta_dg)[17]
It should be noted that, as dangerous goods represent only a small proportion of the freight transported by road, there are considerable uncertainties in the survey results regarding this category of goods.
Road freight transport by type of cargo
In 2022, palletised goods, i.e., goods transported on pallets, represented the main type of cargo in most of the EU countries (see Table 3). The only exceptions were Cyprus and Luxembourg, for which solid bulk represented the main type of cargo.
The EU countries with the highest shares of palletised goods were Romania (70.9 %), Portugal (65.6 %) and Slovenia (63.6 %), while Cyprus (8.6 %), Finland (23.8 %) and Austria (31.3 %) had the lowest shares. When looking at palletised goods and solid bulk taken together, the only countries with an accumulated share below 50 % were: Finland (39.1 %) and Cyprus (49.2 %). As road freight transport by type of cargo is an optional variable of the road freight transport survey, Ireland and Italy did not report it, while Denmark reported all data as 'other cargo not elsewhere specified' and 'unknown'.
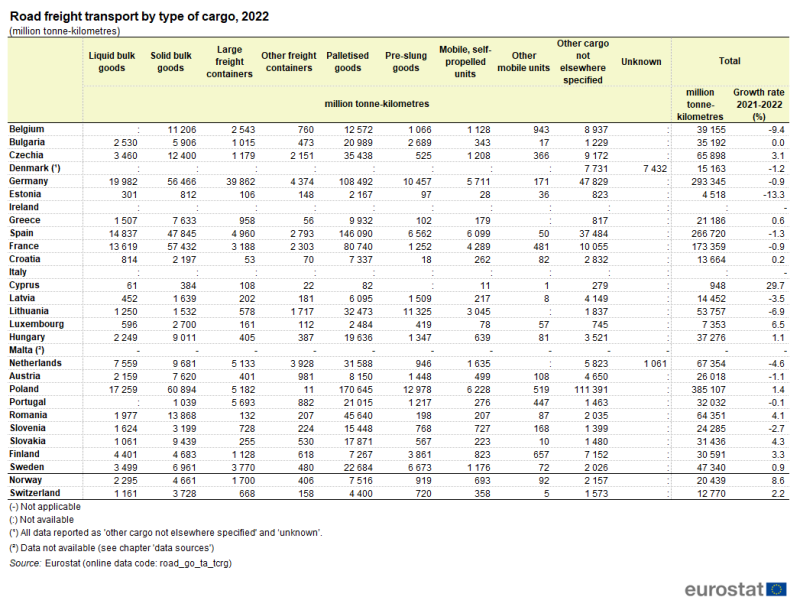 Table 3: Road freight transport by type of cargo, 2022(million tonne-kilometres)Source: Eurostat (road_go_ta_tcrg)[18]
Source data for tables and graphs
Context
Data presented in this publication were collected in the framework of Regulation (EU) No 70/2012[19] on statistical returns in respect of the carriage of goods by road (recast).
These data are based on sample surveys carried out in the reporting countries, i.e., the EU Member States, Norway and Switzerland, and record the freight transport undertaken by road vehicles registered in these countries. Reporting countries use their own national surveys for the collection of data based on returns from road hauliers. The results are microdata referring to vehicles and their linked journeys, providing detailed information on goods transported.
At the European level, common aggregation[20] procedures that might diverge from national practices have been used. Differences might therefore occur between the figures in this publication and national values.
Country specific notes
Croatia: While Croatia had no obligation prior to their accession in 2013, it started to report data from the reference year 2008. Malta: Regulation (EU) No 70/2012 does not apply to Malta, as long as the number of Maltese-registered goods road transport vehicles licensed to engage in international transport does not exceed 400 vehicles.
Finland: National and international surveys have been harmonised and follow a common methodology from Q1 2011 onwards, leading to a break in time series in 2011. Sweden: A break in series occurred in 2014 following a change in methodology. On the basis of a specific survey, Sweden corrected the European road freight survey results for trucks participating in the sample which were not in use over the surveyed period.
Methodological notes
EU totals calculated in this publication refer to road freight transport reported by the EU Member States, excluding Malta which is exempt from reporting road freight statistics.
Total international transport Total international transport includes international transport loaded[21], unloaded[22], cross-trade[23] and cabotage[24]. Breakdown by goods groups
Starting with the reference year 2008, Regulation (EC) No 1304/2007[25] establishes NST 2007[26] as the sole classification for goods carried in road freight transport. For detailed information on the NST 2007 classification, please refer to 'Classifications[27]', in Eurostat's web pages about metadata. Dangerous goods
Regulation (EU) No 70/2012[28] stipulates the collection of information on different categories of dangerous goods on an obligatory basis. Annex V of the Regulation (EU) No 70/2012 provides the categories to be used. As the carriage of dangerous goods by road represents only a small percentage of total road transport and the data are collected on the basis of sample surveys, the margins of error in any statistics will be substantial.
Any figures for the transport of dangerous goods should be treated with caution. Type of cargo is the appearance of the cargo unit on presentation for transportation. The provision of data according to the type of cargo is optional in the legal basis.
As not all EU Member States provide this optional variable, the EU aggregate is not calculated. Tonne-kilometre (tkm): Unit of measure of goods transport that represents the transport of one tonne by road over one kilometre. The distance taken into account is the distance actually run.
It excludes the distance covered when the goods road vehicle is being transported by another means of transport.
Data availability: The figures presented in this publication have been extracted from Eurostat's free dissemination database and reflect the state of data availability in August 2023.
In this article:
- 1 billion = 1 000 000 000
- "- "not applicable
- ": "not available
References
- ^ Glossary:Standard goods classification for transport statistics (NST) (ec.europa.eu)
- ^ Glossary:Tonne-kilometre (tkm) (ec.europa.eu)
- ^ (road_go_ta_tg) (ec.europa.eu)
- ^ (road_go_ta_tg) (ec.europa.eu)
- ^ (road_go_ta_tg) (ec.europa.eu)
- ^ Glossary:Standard goods classification for transport statistics (NST) (ec.europa.eu)
- ^ Glossary:Road freight transport (ec.europa.eu)
- ^ Glossary:Road freight transport (ec.europa.eu)
- ^ (road_go_ta_tg) (ec.europa.eu)
- ^ (road_go_na_tgtt) (ec.europa.eu)
- ^ Glossary:Standard goods classification for transport statistics (NST) (ec.europa.eu)
- ^ (road_go_ta_dg) (ec.europa.eu)
- ^ (road_go_ta_tott) (ec.europa.eu)
- ^ (road_go_ta_dg) (ec.europa.eu)
- ^ Road freight transport by journey characteristics (ec.europa.eu)
- ^ (road_go_ta_dg) (ec.europa.eu)
- ^ (road_go_ta_dg) (ec.europa.eu)
- ^ (road_go_ta_tcrg) (ec.europa.eu)
- ^ Regulation (EU) No 70/2012 (eur-lex.europa.eu)
- ^ Glossary:Aggregation (ec.europa.eu)
- ^ Glossary:Road freight transport (ec.europa.eu)
- ^ Glossary:Road freight transport (ec.europa.eu)
- ^ Glossary:Cross-trade (ec.europa.eu)
- ^ Glossary:Cabotage (ec.europa.eu)
- ^ Regulation (EC) No 1304/2007 (eur-lex.europa.eu)
- ^ Glossary:Standard goods classification for transport statistics (NST) (ec.europa.eu)
- ^ Classifications (ec.europa.eu)
- ^ Regulation (EU) No 70/2012 (eur-lex.europa.eu)