Dual effects of digital technology on high quality development of road transportation in Heilongjiang Province China

Measurement of UDTL and HQDRT levels
Index system construction
To accurately measure the relationship between UDTL and HQRT, this study first establishes a scientific and reasonable indicator system. Given the broad dimensions involved in both UDTL and HQRT, a multidimensional comprehensive indicator evaluation system has been constructed based on a systematic review and assessment of existing research methodologies (Appendix Table). In terms of UDTL, this study encompasses four main dimensions: the level of digital economic development33the status of digital infrastructure construction34digital technology innovation capability35and the government's focus on digital economic policies36. (1)Level of Digital Economic Development: This dimension employs the digital financial inclusion index and per capita telecom business volume as measurement indicators. These two indicators have been widely validated and effectively reflect the current state of the regional digital economy37. The digital financial inclusion index measures the accessibility and convenience of financial services, while per capita telecom business volume reflects the actual consumption of digital services by residents. (2)Status of Digital Infrastructure Construction: This dimension includes indicators such as the number of mobile phone users at year-end, the proportion of employment in information transmission, computer services, and software industries, as well as the number of mobile phone users per hundred people38. A complete digital infrastructure is a crucial foundation for driving the digital economy and green transformation.
Its construction level directly affects the diffusion and application efficiency of digital technologies. The number of mobile phone users and the number of mobile phone users per hundred people can directly reflect the penetration level of digital technologies among residents34. (3)Digital Technology Innovation Capability: Patent applications serve as a more direct representation of innovation outcomes, clearly reflecting the actual output of technological innovation. Compared to other innovation indicators (such as R&D investment), patent data offers advantages in terms of timeliness and comparability.
Furthermore, among patent types, invention patents are more representative due to their originality and technological depth compared to utility model patents39,40. Thus, this study employs patent data as a key evaluation indicator for digital technology innovation capability. (4)Government Focus on Digital Policies: The emphasis on digital policies is assessed by examining the focus on policies related to the digital economy. Policy focus reflects the government's support for digital transformation, impacting resource allocation and market environment, and serves as an important guarantee for advancing digital transformation36. In terms of HQDRT, this study selects indicators for evaluation from four dimensions: basic scale, service quality, industry talent, and innovative potential, based on previous research10,41. (1)Basic Scale Dimension: The indicators selected include highway mileage and year-end actual road area42. Highway mileage reflects the breadth and accessibility of the transportation network and is typically associated with the level of completeness of transportation infrastructure. The year-end actual road area demonstrates land resource utilization, indicating the spatial carrying capacity of infrastructure and providing essential support for the sustainable development of the transportation system. (2)Service Quality Dimension: The focus is on highway passenger traffic and highway freight volume.
Highway passenger traffic, as a key indicator of public transportation services, reflects the convenience of residents' travel and their reliance on public transport, while highway freight volume reveals the efficiency of regional logistics and commercial activities. Together, these two indicators present the ability of the transportation system to meet travel and economic demands43. (3)Industry Talent Dimension: This dimension is assessed based on the proportion of employees in the transportation and warehousing sector and the average wage of employees in the transportation, warehousing, and postal sectors44. The proportion of employees reflects the industry's contribution to the economy, while the average wage indicates the industry's attractiveness and development potential. These indicators are helpful in understanding the state of human resources in the transportation industry and its development prospects. (4)Innovative Potential Dimension: Indicators include the number of green invention patents filed during the year, the number of green utility model patents, and the number of students enrolled in universities, which can provide essential talent support for innovation and development in the transportation industry45,46.
Entropy method
To objectively determine the weights of the relevant indicators for UDTL and HQDRT, the entropy method was employed in this study.
This method has been widely used for determining the weights of various indicators, particularly in contexts involving the assessment of complex systems47,48. The entropy method effectively overcomes the randomness and information redundancy issues associated with traditional subjective weighting methods by measuring the amount of information contained in each indicator and the degree of variation49. A smaller entropy value indicates a greater variation among the indicators, providing more information; therefore, such indicators should be assigned higher weights50. Consequently, the entropy method presents advantages over other methods for determining indicator weights, such as principal component analysis and multiple correlation coefficients. Considering the positive and negative directions of the evaluation indicators, the range method was utilized for the standardization of the data, and the specific calculation process of the entropy method is shown in the following formula.
(1)Data Standardization Process. To eliminate the effects of different dimensions among the indicators, the range method was applied to standardize the raw data. The positive and negative indicators are:
Positive index ££{Z_{ij}} = frac{{{X_{ij}} - min ({X_{ij}})}}{{max ({X_{ij}}) - min ({X_{ij}})}}££ (1)
Negative index ££{Z_{ij}} = frac{{max ({X_{ij}}) - {X_{ij}}}}{{max ({X_{ij}}) - min ({X_{ij}})}}££ (2)
In the equation, Xijrepresents the standardized value of the j-th indicator for city i, while xij refers to the raw value of the j-th indicator for city i. (2)Calculation of Information Entropy Values. First, calculate the weight of the characteristic for the i-th evaluation object under the j-th indicator pij: ££{p_{ij}}={Z_{ij}}/sumnolimits_{{j=1}}^{n} {{Z_{ij}}}££
(3) (3)Calculate the information entropy Ejfor the j-th indicator: ££{E_{ij}}= - ksumlimits_{{j=1}}^{n} {{p_{ij}} times ln {p_{ij}} }££
(4) (4)Determine the weight Wj of the indicator and calculate the weight for the j-th indicator: ££{W_j}={{1 - {E_j}} mathord{left/ {vphantom {{1 - {E_j}} {sumnolimits_{{j=1}}^{n} {(1 - {E_j})} }}} right. kern-0pt} {sumnolimits_{{j=1}}^{n} {(1 - {E_j})} }}££
(5)
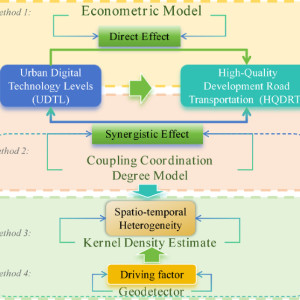
Econometric model
This study employs a two-way fixed effects model to analyze the direct effects of UDTL on the HQDRT, thereby revealing whether a potential synergistic mechanism exists between the two. Although dynamic panel data models and spatial econometric models are commonly used in panel data research, the two-way fixed effects model may be more suitable given the specific context of this study. The reason for this is that this study has a relatively limited sample size, and the research area consists of 12 prefecture-level cities within the same province.
The geographic scope is small, and the level of regional economic development is relatively homogeneous. Consequently, the dynamic panel data model may yield biased or inconsistent results with small samples, and the weak spatial correlation complicates the global spatial correlation analysis. The two-way fixed effects model effectively controls for individual and time fixed effects, reduces endogeneity issues caused by omitted variables, and enhances the reliability of the regression analysis51 thereby accurately identifying the direct impact of UDTL on HQDRT. The formula is shown as (6).
££HQDR{T_{it}}={beta _0}+{beta _1}UDT{L_{it}}+{beta _2}Contro{l_{it}}+{delta _i}+{lambda _t}+{varepsilon _{it}}££ (6) In the formula, i represents provinces, and t represents years. HQDRTit is the dependent variable, indicating the level of high-quality development of highway transportation infrastructure, while UDTLit is the independent variable, representing the level of digital technology in various prefecture-level cities in Heilongjiang Province.
Control variables include the level of economic development (LED), the degree of government intervention (DGI), population density (PD), the degree of openness to the outside world (DOFT), and industrial structure (IS). Additionally, ?i and ?t represent time-fixed effects and individual-fixed effects, respectively, while ? denotes the random disturbance term. The descriptive statistics of each variable are presented in Table 1.
Table 1 Descriptive statistics.Full size table[1]Coupling coordination degree model
After employing econometric analysis to assess the direct effects of UDTL on HQDRT, this study further incorporates the Coupling Coordination Degree Model to quantitatively evaluate the "synergistic effects" between the two.
The Coupling Coordination Degree Model is an important method for assessing the synergistic development of system elements, with its core focus on quantifying the interactive relationships between subsystems to evaluate the functional integration and optimization levels of the overall system52. This model has been widely applied in studies investigating the interactions between urban or regional transportation and other systems53,54. Compared to traditional econometric regression models, the Coupling Coordination Degree Model emphasizes the overall synergistic state between systems rather than focusing solely on the marginal effects between variables.
By introducing two key indicators, coupling degree and coordination degree52,55 it overcomes the limitations of traditional single-indicator evaluation methods, allowing the research to comprehensively reflect the complex dynamic relationships between systems and providing an effective theoretical tool for regional coordinated development. Specifically, the econometric regression model has confirmed the significant promoting effect of UDTL on HQDRT, while the Coupling Coordination Degree Model further evaluates their level of coordinated development from the perspective of system interactions. By combining these two methods, this study not only reveals the direct relationship between UDTL and HQDRT but also comprehensively expresses the potential and current status of their joint development.
The classification standards and categories of the Coupling Coordination Degree are detailed in Table 2. The relevant formulas are presented in (7), (8), and (9) ££C = 2sqrt[{}]{{{U_1}{U_2}}}/({U_1} + {U_2})££
(7) ££T = alpha times {U_1} + beta times {U_2}££ (8)
££D = sqrt[{}]{{C times T}}££ (9) In the formula, C represents the coupling degree of the ternary system, and T denotes the comprehensive evaluation value of the ternary system. Ui is the index of the i-th subsystem, while ? and ? represent the weighting coefficients of the i-th subsystem, where ? + ? = 1.
In the absence of clear data supporting which subsystem--UDTL or HQDRT--is more important, this study follows the conventional approach of previous research47,55 by treating both systems as equally important, with ? = ? = 0.5. Finally, D represents the coupling coordination degree of UDTL and HQDRT.
Table 2 Coupling coordination degree division standards and classification.Full size table[2]Kernel density estimation
Kernel Density Estimation (KDE) is a non-parametric statistical method that reconstructs the probability density function of random variables through smoothing estimation techniques, providing an effective tool for analyzing the spatial and temporal differences in the complex collaborative evolution of different systems56. In this study, the KDE is applied to panel data from 12 prefecture-level cities in Heilongjiang Province from 2011 to 2022, which overcomes the theoretical limitations of traditional parametric methods and directly reveals the intrinsic distribution characteristics of the system from the data itself. Compared to other econometric methods, KDE does not rely on predefined distributional assumptions and can more accurately reconstruct the probability density distribution of the coupling coordination degree.
This flexibility allows for a systematic characterization of the collaborative development trends and differentiated features between UDTL and HQDRT. Furthermore, by integrating KDE with quantitative analysis through econometric regression models, this study can comprehensively reveal the interrelationship between UDTL and HQDRT. Specifically, the econometric regression model provides indicators of the direct impact of UDTL on HQDRT, while KDE systematically characterizes the spatial and temporal convergence trends and differential features of the collaborative development between UDTL and HQDRT at a finer granularity.
££F(x)=frac{1}{{ng}}sumlimits_{{i=1}}^{n} {Kleft[ {({X_i} - x)/g} right]}££ (10) In the formula (10), n represents the number of provinces, g denotes the bandwidth, K is the kernel function, Xi refers to the independently and uniformly distributed sample data representing the coupling coordination degree between UDTL and HQDRT in various prefecture-level cities in Heilongjiang Province, and x represents the mean value of the coupling coordination degree.
Geographical detector
The Geographical Detector, as a spatial analysis method used to explore the spatial variability of geographical factors and the strength of their interrelationships57 can reveal the driving mechanisms of spatial differentiation and quantify the explanatory power of influencing factors on regional disparities. The Geographical Detector consists of two core modules: the factor detector and the interaction detector.
The factor detector computes the explanatory power of various driving factors on spatiotemporal differences in co-evolution, while the interaction detector reveals nonlinear coupling effects between factors, overcoming the limitations of traditional linear regression methods in analyzing complex system mechanisms58. Considering that the co-evolution of UDTL and HQDRT exhibits complex spatiotemporal self-organizing relationships, traditional regression analysis struggles to fully capture the dynamic interaction of driving factors. Therefore, the Geographical Detector is an ideal method for analyzing such complex systems.
Based on the five control variables from the original econometric model, this study further introduces five key variables that may influence the spatiotemporal differences in the co-evolution of UDTL and HQDRT: the level of urbanization, scientific and technological support, the degree of market openness, fixed asset investment intensity, and environmental regulation. Through a systematic analysis of multidimensional factors, this study comprehensively reveals the intrinsic driving mechanisms of regional collaborative development. Furthermore, it attempts to precisely quantify the explanatory power of each factor in the co-evolution process and examines the complex interactions among these factors.
The Geographical Detector is defined as shown in the formula (11). ££q=1 - frac{1}{{N{sigma ^2}}}sumlimits_{{h=1}}^{L} {{N_h}sigma _{h}^{2}}££ (11)
In the formula, q represents the contribution of spatial variation in factor X to the co-evolution of UDTL and HQDRT, ranging from 0 to 1. A higher q value indicates stronger explanatory power. When q equals 1, the influencing factor can fully explain the spatial distribution of UDTL and HQDRT co-evolution.
Conversely, when q equals 0, it indicates no relationship between the influencing factor and the co-evolution of UDTL and HQDRT. h and N represent the number of units in layer h and the entire region, respectively, where h = (1, 2, ..., L) indicates the classification of coupling coordination or factor X. Additionally, ?h2 and ?2 denote the variances of coupling coordination within layer h and the entire region, respectively.
Data source
This study covers panel data from 12 prefecture-level cities in Heilongjiang Province for the period 2011-2022. The Digital Inclusive Finance Index, used to measure the digital economy, was obtained from the Digital Finance Research Center at Peking University.
The attention to digital economy policies was measured by analyzing the frequency of digital economy-related terms in municipal government work reports from various cities in Heilongjiang Province, reflecting the level of government support for the digital economy. Data on digital economy-related patents and green technology patents were primarily sourced from the China Research Data Services Platform (CNRDS). Other indicators used to measure the level of digital technology and the high-quality development of highway transportation infrastructure were obtained from the National Bureau of Statistics of China, the China City Statistical Yearbook (2011-2023), and the EPS database.
Additionally, the geographical data for this study were sourced from the Resource and Environment Science Data Platform of the Institute of Geographic Sciences and Natural Resources Research, Chinese Academy of Sciences.
To ensure data completeness and scientific rigor, linear interpolation was used to estimate missing values for certain indicators.
References
- ^ Full size table (www.nature.com)
- ^ Full size table (www.nature.com)