Freeport McMoRan: An uncertain future
Introduction
Freeport-McMoRan ![]() FCX announced its first-quarter 2025 results on April 24, 2025. This article updates my GuruFocus article from December 20, 2024, in which I analyzed the third quarter of 2024.[1]
FCX announced its first-quarter 2025 results on April 24, 2025. This article updates my GuruFocus article from December 20, 2024, in which I analyzed the third quarter of 2024.[1]
Freeport-McMoran Inc. is a prominent company in the global copper industry, consistently ranking among the top copper producers in the world. The company operates major mining operations in both North and South America.
It is known for its flagship Grasberg mine in Indonesia, one of the largest global copper and gold deposits. Freeport plays a crucial role in satisfying the global demand for copper.
Freeport-McMoran is one of the four leading companies in the copper mining industry. Among these four, Freeport-McMoran and Southern Copper ![]() SCCO are the most focused on copper production.
SCCO are the most focused on copper production.
Freeport leverages top-tier assets like Grasberg and is expanding its production in the United States, while Southern Copper benefits from exceptionally low-cost operations in Peru and Mexico. FCX and SCCO held the highest copper reserves in 2023.[2]

Though a major player in copper through its stake in Escondido, BHP ![]() BHP remains diversified with a broader portfolio that includes iron ore and coal. Glencore (GLEN.L), while producing substantial copper, distinguishes itself with its integration of mining and trading and its growing involvement in copper recycling and African operations.[3]
BHP remains diversified with a broader portfolio that includes iron ore and coal. Glencore (GLEN.L), while producing substantial copper, distinguishes itself with its integration of mining and trading and its growing involvement in copper recycling and African operations.[3]
A large institutional investor's ownership.
Freeport-McMoran ![]() FCX stands out as a compelling investment for large institutional investors seeking long-term exposure to the materials and energy sectors.
FCX stands out as a compelling investment for large institutional investors seeking long-term exposure to the materials and energy sectors.
As one of the world's leading copper producers and a constituent of major stock indices like the S&P 500, FCX is a natural holding for firms such as Vanguard, BlackRock, and State Street, which manage vast index funds and exchange-traded funds (ETFs). Its inclusion in these indices creates a structural incentive for ownership by passive investment strategies.[4]
Institutional investors are increasingly focused on long-term macroeconomic trends, such as the global shift toward renewable energy, electric vehicles, infrastructure development, and industrial growth.
FCX offers direct exposure to these themes with a scale, diversification, and stability that smaller mining companies often lack. As a result, institutional ownership in FCX is notably high, with approximately 83.8% of shares held by institutions.
Vanguard Group alone holds 8.7%, while BlackRock Advisors LLC owns 5.4%.
What do the near- and mid-term outlooks look like for copper and copper companies?
These four companies are highly sensitive to global economic conditions because the demand for copper is closely linked to industrial activity and infrastructure development. The trade tensions and tariff policies initiated by the Trump administration created significant uncertainty that temporarily affected copper prices and the valuations of mining companies. While these policies posed short-term challenges for the copper industry, broader factors such as global stimulus efforts, supply dynamics, and the accelerating energy transition have become more influential in shaping long-term demand and pricing for copper.
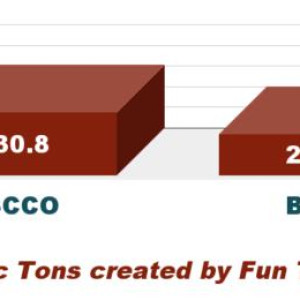
However, this is only true to a certain extent.The recent liberation day held in the Rose Garden by Donald Trump had a chilling effect on copper and copper companies, as the chart below illustrates:

Although the copper price has increased by 3.6% year over year, the four companies have experienced a significant decline during the same period. Even FCX, which produces gold, is down by 22% year-over-year.
As we can see above, the simple announcement of drastic tariffs threw the market off by about 25-30% in two days. As explained in my recent article, it was clearly a grey swan event.
The market has rebounded, partly due to temporary relief measures such as the Trump administration's 90-day tariff exemption, which did not apply to China, by the way.
However, the ongoing risk of unresolved trade tensions remains significant. This uncertainty could negatively impact copper demand and investor sentiment without a comprehensive resolution, particularly given the industry's sensitivity to global economic stability.
Despite the recent surge in market confidence, the recovery appears to be driven more by sentiment than by substance. While officials in the Trump administration have offered reassuring public statements, there is no verifiable evidence that formal negotiations with China are actually underway.
In fact, Chinese authorities have explicitly denied that any talks have taken place, casting further doubt on the narrative of progress.
Elsewhere, discussions with other nations impacted by the latest round of U.S. tariffs are ongoing but remain inconclusive. The reality is that forging comprehensive trade agreements, particularly in today's complex geopolitical climate, takes time. The unilateral imposition of tariffs by the United States, often without consultation or warning, has eroded trust among key allies and partners.
For many, the willingness of the U.S. to "renegotiate" longstanding agreements, as seen with Canada and Mexico, raises fundamental questions about the reliability of any future deal. Confidence is essential in business.
This pattern disrupts global markets and undermines the credibility of U.S. commitments. In international trade, trust and predictability are just as important as economic power.
Without them, even the strongest economies risk isolating themselves and weakening the alliances that are essential for global stability.
China is likely to maintain a firm stance in this trade war, shaped in part by its historical experiences with foreign intervention and its longstanding emphasis on national sovereignty. While the immediate economic pressures it faces may appear more severe, China's political structure and cultural resilience position it to withstand prolonged strain.
By contrast, the U.S. economy is already showing signs of significant disruption, and the broader effects of the tariffs are expected to ripple through all sectors in the coming weeks. These measures could result in serious economic consequences if not addressed swiftly.
Although China will not be immune to hardship, its capacity for strategic endurance may outpace that of the United States.The American response, on the other hand, risks being hampered by political volatility and a lack of cohesive strategy.
As the effects of the trade war start to become more evident, President Trump is likely to face increasing pressure, both economically and, more importantly, politically.
This may compel him to quickly reverse his policies in order to prevent deeper fallout during his administration.
What will the copper industry look like in 2025-2026?
In conclusion, while Donald Trump successfully applied economic pressure on China in 2016, his attempt to replicate that strategy in 2025 appears far less effective. In the intervening years, China has taken substantial steps to reduce its economic dependence on the United States, making it far less vulnerable to the same tactics.
This time, China seems determined not to allow a repeat of past concessions. It now possesses a broader arsenal of economic tools capable of inflicting real damage on the U.S. economy.
Trump's critical miscalculation may lie in underestimating both China's resilience and its strategic capacity to adapt. This could ultimately undermine the U.S. position in the current standoff.
The key question now is not whether there will be consequences but how long the administration will persist before reassessing its approach and how much damage will be done to the global economy in the interim. Given the current trajectory and the entrenched political dynamics, a near-term resolution appears unlikely.
As a result, I remain pessimistic about the outlook for 20252026, particularly in the copper market.
Unless diplomatic breakthroughs occur soon, which seems doubtful, major mining companies, including Freeport, may face considerable pressure and valuation declines in the months ahead. Therefore, be careful and wait for a significant retreat of the market to accumulate again. Meanwhile, trading short-term LIFO using technical analysis should be considered the best approach.
A succinct look at Freeport McMoran's recent fundamentals with historical charts.
Freeport-McMoRan's Q1 2025 results show a mixed but cautiously optimistic outlook.
The company reported revenue of £5,728 million and earnings of £0.24 per diluted share, slightly exceeding expectations despite challenges in production. Notably, the output at Grasberg has been consistently underperforming, contributing to the disappointing production results.

While copper and gold sales were down sharply, higher commodity prices helped cushion the impact. Copper price reached £4.44 per pound in 1Q25, which is above average, as the chart below illustrates.

In April 2025, copper prices fell by 8.4%, marking the steepest monthly decline since June 2022.
The outlook for the remainder of 2025 is uncertain, largely due to China's significant role in the copper market. I do not anticipate that China will maintain strong demand for copper this year, especially in light of the ongoing tariff war. While long-term growth in copper demand is still expected due to the green transition and infrastructure investments, the immediate future appears to hinge heavily on the resolution of trade tensions and China's economic recovery.
We have reached a zero-sum phase.
I am not optimistic that a quick de-escalation is possible to facilitate a swift recovery. In fact, I believe China is determined to make the US suffer to demonstrate its power, even if it comes at the cost of a painful economic slowdown. I would not be surprised if the copper price falls below £3 at some point in 2025.
The gold price reached a record high of £3,072 per ounce in 1Q25 and is on track to set another record in 2Q25.

JPMorgan and Goldman Sachs project prices will rise to between £3,600 and £3,700 by the end of 2025.
However, I am somewhat less optimistic and expect a retracement in 4Q25 to around £3,100 per ounce.
In 1Q25, Freeport-McMoRan experienced an increase in unit production costs, including higher expenses for fuel, explosives, labor, and energy, particularly across its Latin American and Indonesian operations.
These increases were compounded by operational challenges such as weather-related disruptions and lower ore grades, which led to greater inefficiencies and higher cost-per-pound, with copper unit net cash costs rising to £1.66 per pound, up from £1.54 per pound in 4Q24.
The company also faced ongoing pressure from logistics and maintenance costs. Together, these factors significantly impacted margins, especially in the context of declining copper prices during the same period. Copper, gold and molybdenum production were significantly down.

In 1Q25, Freeport-McMoRan's free cash flow (FCF) faced pressure due to higher unit costs.
Cash from operations totaled £1,058 million, while CapEx was £1,172 million. The free cash flow for the quarter amounted to negative £114 million, which is disappointing, especially compared to the £642 million made in 1Q24. Unfortunately, the limited FCF in 1Q25 constrains flexibility for shareholder returns or discretionary investments.

The company maintains a quarterly dividend distribution, with the most recent payment of £0.15 per share, comprising a £0.075 base dividend and a £0.075 variable component, made on May 1, 2025.
Given the current challenges, including rising production costs, declining copper prices, and escalating U.S.-China trade tensions, there is growing potential for Freeport-McMoran to adjust its variable dividend component in the coming quarters.
Freeport-McMoRan's total debt in 1Q25 stood at £9.404 billion, with a debt-to-equity ratio of 32.2%. The company had £4.385 billion in cash and short-term investments and a net debt of £5.02 billion. FCX wants to reduce its debt by £1 billion in 2025, but it may not be able to do so.
 Technical Analysis: Descending Channel Pattern.

Note: The chart has been adjusted for dividends.
Freeport McMoRan ![]() FCX is currently forming a descending channel pattern, with resistance at £40.75 and support at £31.4.
FCX is currently forming a descending channel pattern, with resistance at £40.75 and support at £31.4.
The Relative Strength Index (RSI) stands at 57 and is trending upwards, signaling a weak bullish trend that could potentially indicate an overbought condition. While a descending channel is typically seen as a bearish formation, suggesting the price could break lower, it also presents the possibility of a bullish breakout once the pattern concludes.[5]
An intermediate level of support/resistance appears around £36.70, coinciding with the 50-day moving average (50MA). This level warrants attention for potential trading opportunities.
However, as I previously noted, FCX may have established a new support zone at £36.50, contingent on the global geopolitical landscape not deteriorating further. It's crucial to wait a few trading sessions to confirm that the rebound from the £32 support is solid and not just a false signal.
The overall market sentiment remains uncertain, driven by speculative optimism rather than fundamental changes. If negotiations spearheaded by the Trump administration don't produce significant results, this rally could quickly lose steam.
In the coming weeks, the situation will become more critical at the five major West Coast portsLos Angeles, Long Beach, Oakland, Seattle, and San Diegowhere the final shipments exempt from the new tariffs are being received.
Similarly, within a few weeks, ports on the East Coast, including New York, Baltimore, and Norfolk, will face the same pressure.
Given these dynamics, I suggest trimming 10-15% of your FCX position if the stock price rises above £36.50.
It will allow you to set aside cash to potentially buy back shares below £32.
If FCX rallies on positive news, consider selling an additional portion of your position in the £38.50 to £41.25 range.
In my previous analysis, I highlighted the value of taking partial short-term profits using the Last In, First Out (LIFO) method, particularly for stocks like FCX.
For balanced risk management, I recommend allocating about 70% of your FCX position to short-term trading, while maintaining a core long-term investment with the expectation of future dividend increases.
Warning: The technical analysis chart should be updated regularly.